App Store English
Older meters use a rotating metal disc to show live power consumption. In newer meters and smart meters, this disc is replaced by LED-light. With this app you can determine your live power consumption on either meter. The rotations and flashes reflect the power consumed at the time. On for example a disc meter, 300 rotations are equal to 1 kWh. In most LED meters 1000 flashes is equal to the consumption of 1 kWh. So by registering the rotations or frequency of blinking you can determine your live power consumption. What’s the point? It is particularly interesting to determine what your night- or standby power consumption is. On an annual basis it makes a big difference whether this is an average of 80 or 250 Watts. With this app you can discover what the big energy consumers are at your home.
- Measuring screen
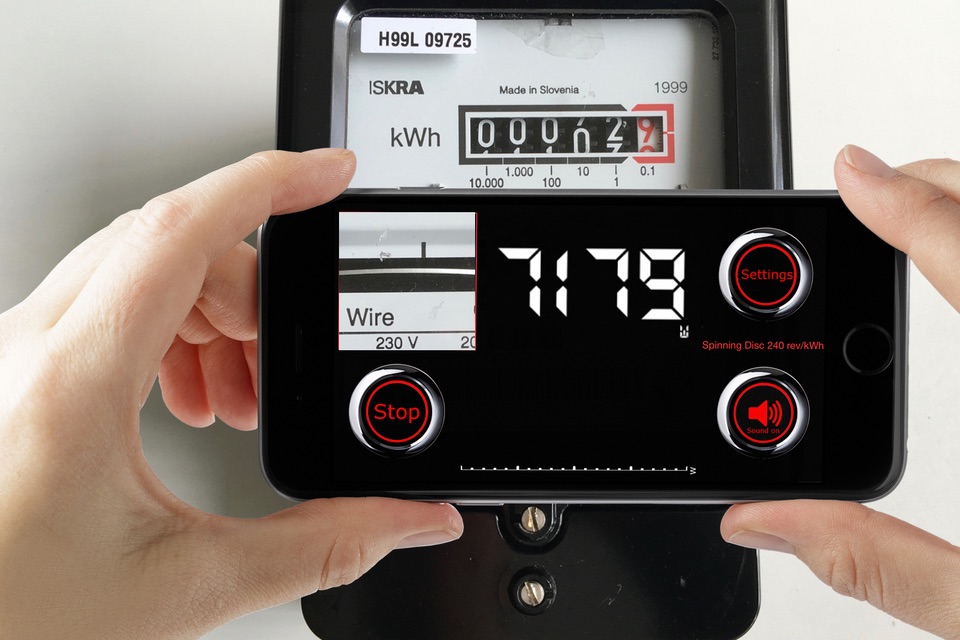
The square black box at the top left of the display shows the camera image of your device. Aim the camera on the LED light or rotating disc. In the middle of this screen are cross-hairs. The optimal distance to the electricity meter may vary. between 0 and 30 cm depending on the circumstances. This is a matter of trial and error. Do you choose “Manual” a touch-button appears. You can use this button to enter each rotation of LED-blink manually.
- Measurement value.
The number shown is the current consumption in Watt, 1000 Watt is 1kW. The maximum value displayed is 9999 Watts.
- Settings
In this menu you can choose your meter type, LED- or Disc meter. You can also choose for manual input of the rotations or LED-flashes. You can select the value which represents the amount of rotations or LED-blinks for kWh. You can also customize the colour of the LED and you have the possibility to set the sensitivity of the camera.
- Start/Stop
With this button you can start and stop a measurement. By stopping the measurement, the chart remains fixed and you can, for example, make a screenshot. Screenshots are created by pressing the home button and the on/off button of your device simultaneously. The photo is then saved to your camera roll.
- Chart
The graph displays the most recently measured values. If you turn on a device during a measurement and turn it off again a few moments later, you will see the consumption of that specific device as a peak visible in the chart. The unit is Watt.
- Sound
With the button at the bottom right in the screen, you can turn the sound signal on or off.
The app also works offline, there is no active internet connection needed.

